Skills
Data Visualization
Challenge
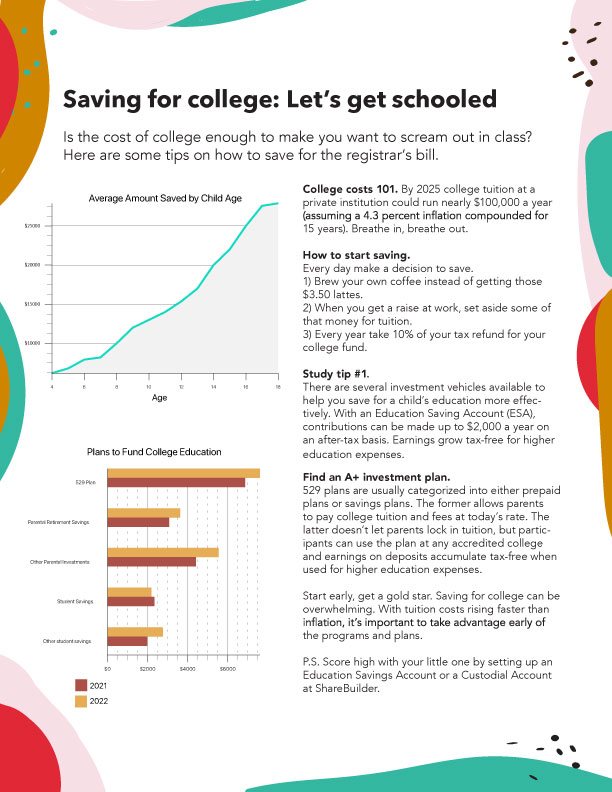
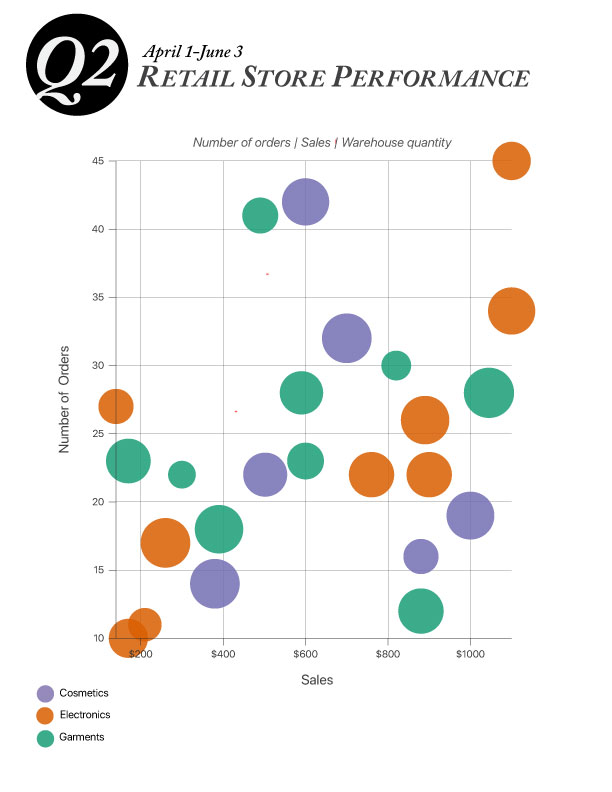
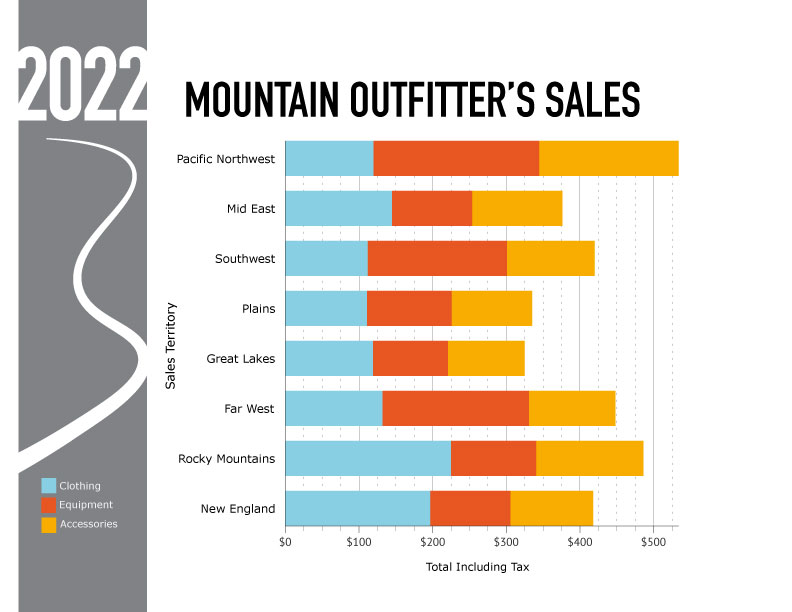
Using an Excel spreadsheet, I import the data and create these graphs so that people/companies can better understand and digest information. When/if data changes, the graphs can be simply updated in their original form and then newer graphs automatically replace the older ones in corresponding design programs in Illustrator and InDesign . Graphs scale to size needed and can be used in digital and print formats.

I also wrote the copy for the below article.